Contents
Overview
Editing rules
Applying Rules
Such a rule is represented by two simple graphs. One represents the hypothesis (e.g. [woman]-1-(mother of)-2-[human]) the other represents the conclusion ([human]-1-(child of)-2-[woman]). Furthermore, there is a link between the first person in the hypothesis and the second person in the conclusion, and a link between the second person in the hypothesis and the first person in the conclusion. A rule "if A then B" is used as follows: if an annotation contains A then B can be added to the graph. See below the graphical representation of this rule:
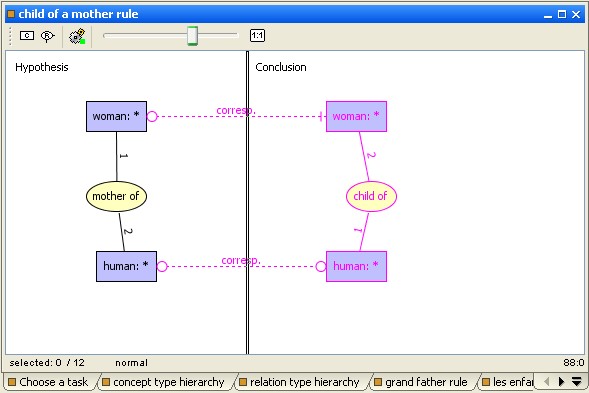
a rule example
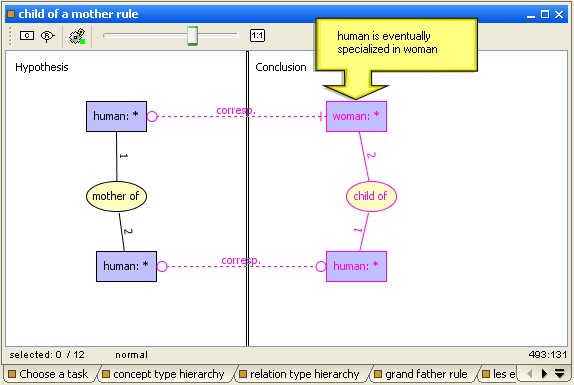
A bi-colored representation of this rule could be simplest with just a conclusion relation "child of" added to the hypothesis. The advantage of this representation is that it allow specialization of a concept type in the conclusion. For instance, from the hypothesis [human]-1-(mother of)-2-[human] it can be deduce that the first person is a woman. Thus, rule represented below is more powerful than previous example:
But it is better to express each deduction in a separate rule and add a new rule to the first one:
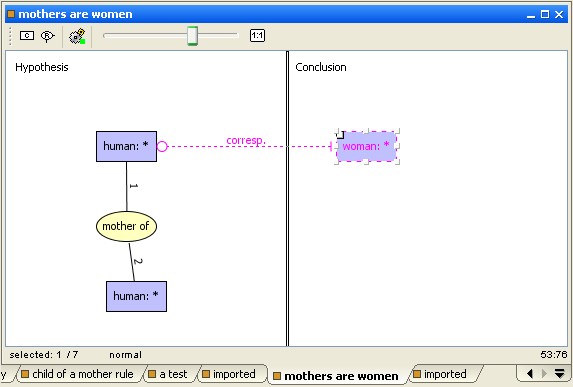
a simple rule for each deduction
Do not worry about rule applying order, even if the first rule is not applied in a first step, it can be appliable after applying another one. All rules are tried until saturation (when no rule is appliable).
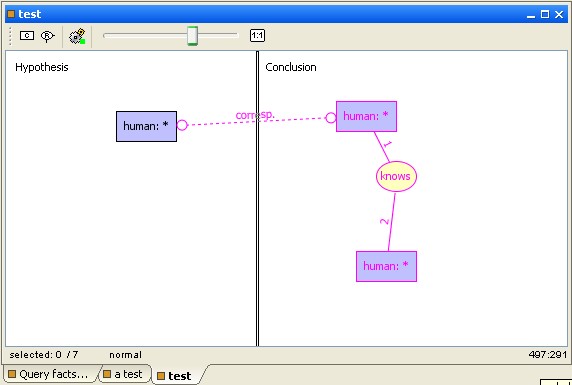
Due to saturation, rules must be builded carefully when at least one rule can create new concepts: The rules may loop and cause an infinite production of concepts. Example below is trivial but combinations of rules can generate loops very difficult to detect.
Use selection panel to select one fact graph and any set of rules. Rules can be selected by folder or individually.
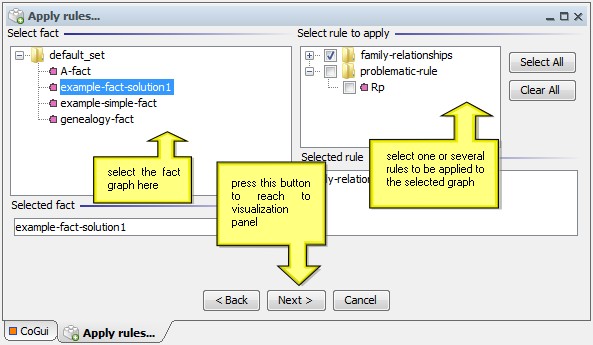
select fact and rules to apply
Next panel apply rules and visualize rule applications step by step.
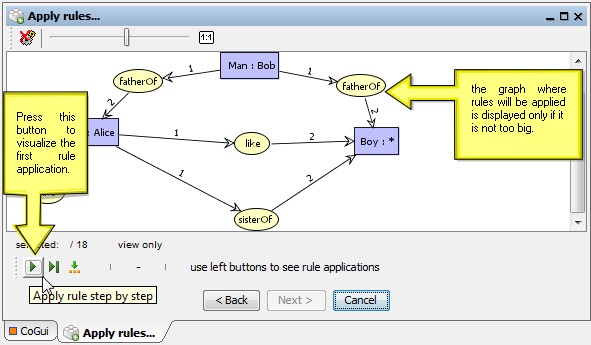
applying rules step by step
the rule assistant toolbar
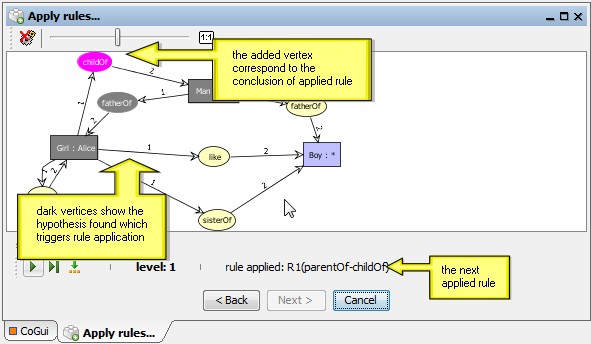
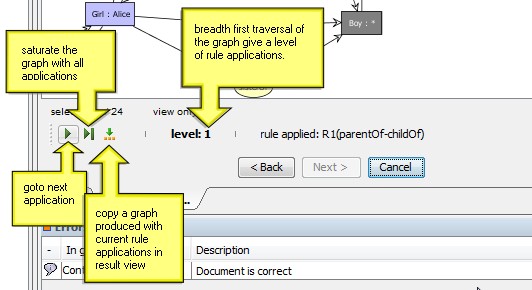
Cogitant do a breadth first traversal of the graph and deduce all applications before taking into account the new vertices added by previous rule applications. This give us the level of application to inspect the generation of current triggerring rule.
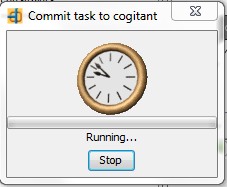
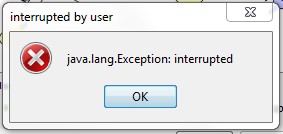
saturation of the graph can be stopped by user
Overview
Rules are used to represent implicit (common sense) knowledge. For instance, let us assume that the fact that Eve is the mother of Abel is represented in a fact graph. If the ontology contains a rule saying that if x is the mother of y then y is a child of x then the system can automatically add the information that Abel is a child of Eve.Such a rule is represented by two simple graphs. One represents the hypothesis (e.g. [woman]-1-(mother of)-2-[human]) the other represents the conclusion ([human]-1-(child of)-2-[woman]). Furthermore, there is a link between the first person in the hypothesis and the second person in the conclusion, and a link between the second person in the hypothesis and the first person in the conclusion. A rule "if A then B" is used as follows: if an annotation contains A then B can be added to the graph. See below the graphical representation of this rule:
a rule example
A bi-colored representation of this rule could be simplest with just a conclusion relation "child of" added to the hypothesis. The advantage of this representation is that it allow specialization of a concept type in the conclusion. For instance, from the hypothesis [human]-1-(mother of)-2-[human] it can be deduce that the first person is a woman. Thus, rule represented below is more powerful than previous example:
this
rule could generate some specializations
But it is better to express each deduction in a separate rule and add a new rule to the first one:
a simple rule for each deduction
Do not worry about rule applying order, even if the first rule is not applied in a first step, it can be appliable after applying another one. All rules are tried until saturation (when no rule is appliable).
Due to saturation, rules must be builded carefully when at least one rule can create new concepts: The rules may loop and cause an infinite production of concepts. Example below is trivial but combinations of rules can generate loops very difficult to detect.
this
rule will
cause a loop
Fortunately
it
is possible
to interrupt the running task if it did not end after a "reasonable"
time. See chapter below to know how to use the rule assistant.
Editing rules
To create a new rule or edit an existing rule go on the tree project into the "Rules" item and use the popup menu (right-click). As other graphs, rules are organized in folders. It is particularly interesting to classify the rules on families, especially for testing purposes. Editing rules is very similar to editing simple fact graphs. But the editor is splitted in two parts: hypothesis and conclusion. By default hypothesis is placed on the left part and conclusions on right part of the editor. The split bar can be oriented with the mouse to horizontal position, in this case hypothesis is placed on top and bottom is reserved for conclusion.
Applying rules
For now cogui only implements forward chaining technique and applies rules to the facts in order to produce new facts. The rule assistant helps to apply a selected set of rules to a graph. This operation can be launched for saturation or followed and visualized step by step. The new resulting graph can be added to the knowledge base.| Launch the rule assistant from the toolbar or choose the "reasoning/apply rule..." option in the main menu. | 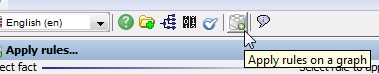 |
Selection
Use selection panel to select one fact graph and any set of rules. Rules can be selected by folder or individually.
select fact and rules to apply
Rule application
Next panel apply rules and visualize rule applications step by step.
the second panel of the rule
assistant
applying rules step by step
the rule assistant toolbar
Cogitant do a breadth first traversal of the graph and deduce all applications before taking into account the new vertices added by previous rule applications. This give us the level of application to inspect the generation of current triggerring rule.
saturation of the graph can be stopped by user
