1
Simple graphs (SGs)
2 Graphs with nestings
1
Simple graphs (SGs)
1.1 Overview
A
SG
is labeled bipartite graph. One class of nodes (the concept nodes) is
used to represent entities of the discourse universe. A concept node
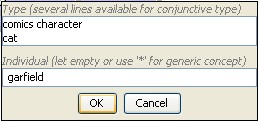
is labeled by a concept type (e.g. Painter,
or a conjunctive type such as Painter,Catalan) and,
possibly, by an
individual (e.g. Picasso).
A concept node which is labeled by a concept type without an
individual is called a generic concept node. Such a node represents
an unidentified element of the type. For instance, contrarily to a
node labeled [Painter : Picasso]
representing the painter
Picasso, a concept node labeled [Painter]
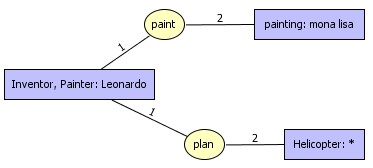
represents “a” painter.The
second class of nodes represents the relationships between the
entities (represented by the concept nodes). For instance, if
Guernica is an individual representing the well-known painting realized
by
Picasso then a relation node labeled (hasPainted)
could relate the concept node [Painter
: Picasso] to
the concept node
[Painting :
Guernica].
The edge between
(hasPainted)
and [Painter
: Picasso] is
labeled by 1, and the
edge between (hasPainted)
and [Painting
: Guernica] is
labeled by 2. This
edge labeling is used to represent different roles (e.g. to
distinguish the subject
from the complement). It is also possible to say that two different
concept nodes represent the same entity by linking them by a
coreference link.
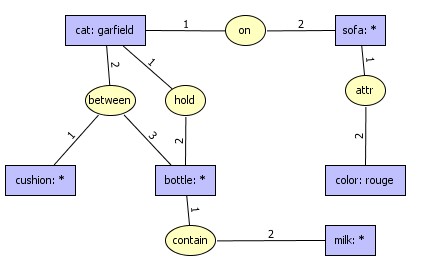
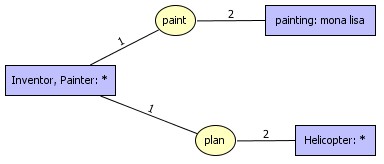
Picture
below is described by a simple graph:
 |
conceptual
graph description of the picture
|
1.2
Create and edit facts
New facts and sets of facts can be created by the popup menus of
"Facts" item and sub-items from project tree. After creating and naming
a
new graph, edit by selecting "Edit" menu, or by clicking twice on tree
item. An empty graph editor is opened. Use same "Edit option" to
re-open existing facts.
 |
When
the fact graph contains too many vertices, it couldn't be possible
to display the entire graph. In this case the "Edit" menu
item opens the fact
graph "partially" (See 1.6 about partial edition). Choose "Edit whole
graph" to force the edition of all graph. |
1.3
Concept insertion
New concepts are inserted by using "Graph/insert vertex/Insert concept"
from the main menu or the contextual popup menu or the local toolbar
option  .
Concept types dragged from the concept types tree cause the creation
of a new generic concept of these type. Concepts associated
with
individuals can be dragged from individual view. The newly created
concepts have the privileged type of the individual.
.
Concept types dragged from the concept types tree cause the creation
of a new generic concept of these type. Concepts associated
with
individuals can be dragged from individual view. The newly created
concepts have the privileged type of the individual.
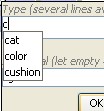 |
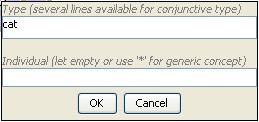
Double left click
triggers a popup dialog to define type and
individual associated with selected concept. when the user begins to
enter
text, a list of compatible terms are listed for both concept types and
individuals..
|
Examples:
 produce
->
produce
-> 
 produce
->
produce
-> 
 produce
->
produce
-> 
|
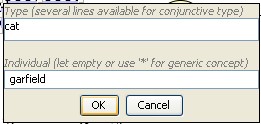
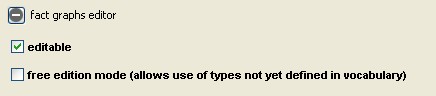
When
an
individual is not already defined, it is automatically created in
knowledge base. For type definition, two modes are available: strict
mode doesn't accept undefined concept type, free mode accept references
to type which is not already defined in vocabulary. Check "free edition
mode" in preferences/General if needed. Modes also act on relation
types.
Free edition can be useful during the building of the ontology, it
avoids to go back to vocabulary editor. But, of course, it must be
done,
error messages can help:
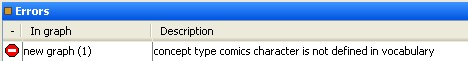 |
1.4
Relation insertion
New relations are inserted by using "Graph/insert vertex/Insert
relation"
from main menu or contextual popup menu or local toolbar option  .
Relation types dragged from
the relation types tree causes the creation of a new
relation.
.
Relation types dragged from
the relation types tree causes the creation of a new
relation.
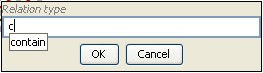 |
Double left click triggers a popup dialog to define
type associated with selected relation. when user begin to
enter
text, a list of relation types is listed. |
The insertion of the relationship is not sufficient, we must
also
link the relation to adjacent concepts. Chapter 1.3.1.4 explains how to
create an edge between two vertices.
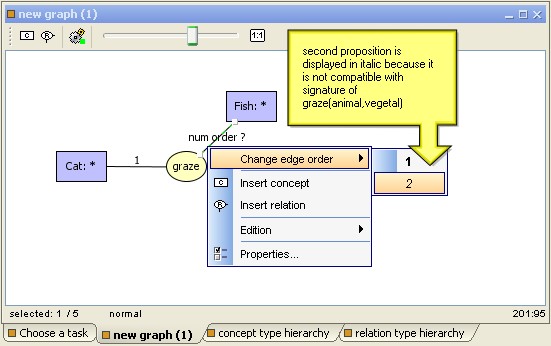
Because the relation signature is ordered, edges between concepts and
relation are associated with a number from 1 to relation arity. Edge
order can be defined with popup menu on the selected edge.
You can also use double-click on selected edge, edge label successively
takes all compatible values between the relation signature
and
the
type of concept.
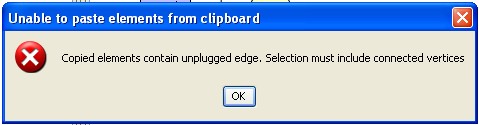
Of course, copy/paste mechanism can also be used to duplicate pieces of
graphs inside the graph or from one to another. Pending edges cannot be
copied. Otherwise this error message appears when you try to copy:
See chapter 1.3.1.2 about objects selection
1.5
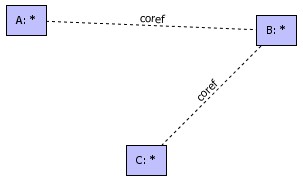
Coreference
It is also possible to say that two different concept nodes represent
the same entity by linking them by a coreference link.
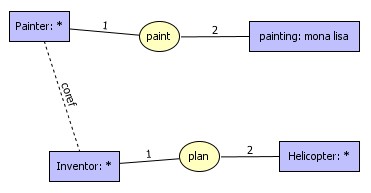
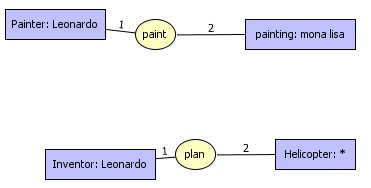
|
coref
links means that painter and inventor are the same person
|
resulting
normalized graph in knowledge base
|
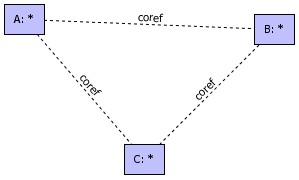
|
Painter
and Inventor are implicitly coreferent
|
resulting
normalized graph
|
Current
version of COGXML
doesn't store
coref links explicitly but it stores the coreferent sets of concepts. A
closure of all possible coreferent links is builded when reading a
COGXML representation of the graph. Example below shows a new
coreference link has been added after restoring operation.
 |
restored graph
|
1.6
Reduced edition
If a graph is too big it could be very tedious (or
impossible) to
edit it entirely. In this case, CoGui provide a reduced edition mode.
Just a part of the graph is displayed. Visible relations are always
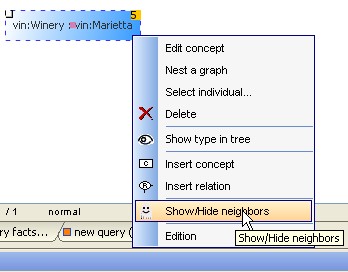
completed, but displayed concept can have hidden neighbors. Example
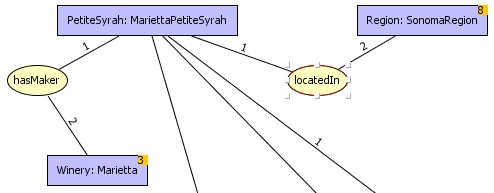
below shows concepts with hidden neighbors, the number of hidden
neighbors is displayed on the upper right corner of the concept.
|
how to show the
neighbors of [Winery:Marietta]
|
 |
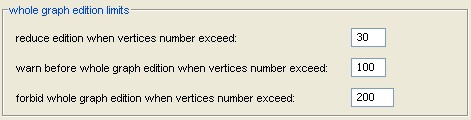
In the fact graph paragraph of general section of preferences, the user
can defined limits to choose partial edition rather than whole
graph edition:
limits
for partial
edition in
preferences dialog
If a big graph is
directly edited from the project tree,
some vertices
are chosen by default. The user generally prefers to display and update
a
precise piece of graph. To correct errors inside the graph, choose the
edit
option on the message in the error view and the graph will be
automatically
opened with the vertices that generated the error. When another error
is
selected, the previous edition is replaced by the edition of the new
concerned
vertices.
To edit parts of the graph without any error, we must query the graph
(See chapter 5) and browse through projections in the result view.
2
Graphs with nestings
2.1
Overview
Nested graphs can be inserted inside a concept, these subgraphs are
typed (see chap.2.6 about nested types).
Why use nested graphs rather than a "flat" graph to represent
informations ?
Consider, for instance, a cottage. It is possible to distinguish
internal from external pieces of information about that cottage. The
owner's name can be considered as an external piece of information
concerning the cottage, whereas the number of rooms is internal
information.
In information retrieval the ISBN number of a book can be considered as
an external piece of information about that book, whereas the subject
of the book is an internal piece of information. In these examples, the
internal information can be also called (partial) description of the
cottage or of the book).
Zooming is a related notion. Let us consider again the cottage example.
Having the land registry position of the cottage, one may want to zoom
into the cottage, e.g. one may want to have the cottage blue
print, which can be considered as an internal information about the
cottage. Or, at a deeper level, having the cottage blue
print,
one may want to know the furniture distribution in a specific room. In
the book example, zooming can consist of obtaining the content of a
chapter from a reference to this chapter (e.g. the number of this
chapter).
Nested graphs can also be related to the notion of context. For
instance, in the previous cottage example, the context of the furniture
distribution (in a room) is precisely the room having this furniture
distribution; the context of the content of a book chapter is precisely
this chapter, and so on. The notion of context is close to the two
previous notions of external versus internal piece of information, and
to zooming. Indeed, zooming takes its full meaning when one knows from
where the zooming is done, and an internal piece of information takes
its full meaning when the piece of information whose it is an internal
piece of information is known. In the forthcoming model only very
simple contexts can be represented. Indeed, a context will be
represented by a path of nested concept nodes. Thus, having in mind
partial description as an intuitive meaning of what we aim to represent
is more convenient than context. A partial description can be included
into another partial description, thus a recursive model is proposed,
and the entities are represented by a hierarchical structure. Similarly
to the classical notion of ``boxes within boxes'' used in document
processing, a nested graph consists of ``graphs within graphs''.
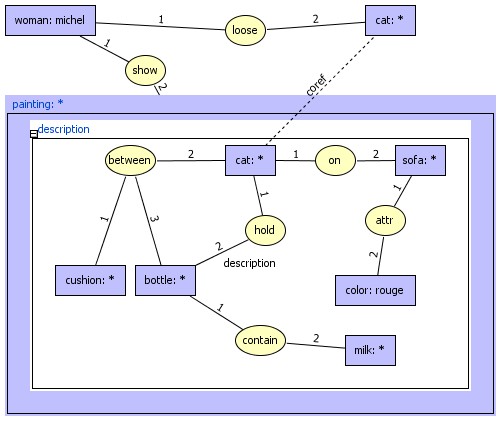
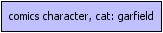
Example below say at first level that "Miss Michel has lost her cat,
she shows a painting".
second level include a nested graph of the type "description" to
describe the painting and finally, the coref link expresses the fact
that
the cat appearing on the painting is, indeed, the lost cat.
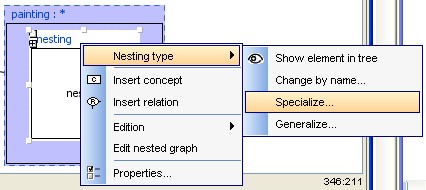
2.2 Nesting a graph
To insert a new nested graph inside a
concept, select the concept and right click to obtain to contextual
menu:
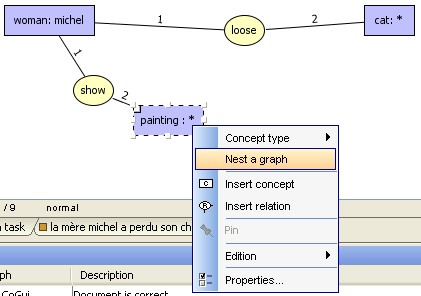 |
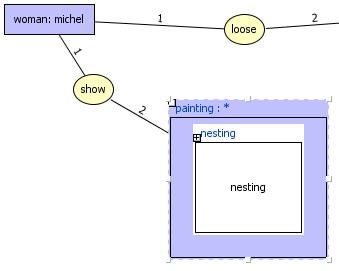
nested
graph is added to the concept with default nesting type "nesting"
|
|
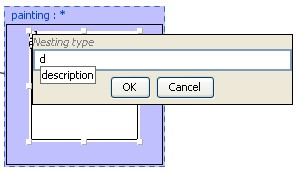
click
on the left upper corner of the nested box to change the type directly
|
or
use contextual menu to change type
|
2.3
Nested graph edition
Nested graphs can be edited directly at the level of graph containing
the parent concept (called the root graph), or edited alone as a
classical graph.
Use contextual menu to edit the nested graph alone in the editor and
return to the root graph:
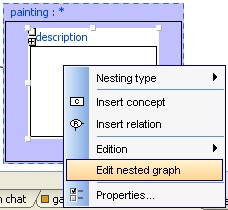 |
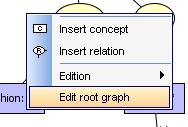
Choose "Edit
nested graph" option to edit the nested graph alone.
After editing the
nested graph, choose this menu option to retreive to root graph edition |
Sometimes it may be useful to view the graph root and the nested graphs
at the same level. The + sign on the left of the nested graph expands
the box to make the nested graph visible. It is useful to see the
graphs but it becomes more complex to edit the content of the nested
graph. However, it is very convenient to
insert a pattern graph or drag selected objects to the nested graph.